🚀
Automating project start-up
🔥 Goal
- Awareness
- Good practices
- Examples of use
🔥 Programme
- Introduction to GIS
- The problem
- Good practices
- Collecting data
- Managing data
- Helpful libraries
🌍 1. Introduction to GIS
Map projections
What deceives us?
Height systems
- PL-KRON86-NH – until December 2023 at the latest
- PL-EVRF2007-NH
Geodetic reference frames in Poland
the mathematical and physical realisations
of the European Terrestrial Reference System ETRS89,
marked as:
- PL-ETRF2000
- PL-ETRF89
Planar (projected) coordinate systems
- PL-LAEA
- PL-LCC
- PL-UTM
- PL-2000 – 15ºE, 18ºE, 21ºE and 24ºE, numbered 5, 6, 7 and 8
- PL-1992
Zones
- EPSG:2180 – whole of Poland, PL-1992
- EPSG:2176 – PL-2000/15
- EPSG:2177 – PL-2000/18
- EPSG:2178 – PL-2000/21
- EPSG:2179 – PL-2000/24
Kinds of data
- raster
- vector:
- points
- lines
- polygons
- databases (tables)
Services
- XYZ
- WMS / WMTS
- WFS
🙈 🙉 🙊 2. Let's define the problem
🛫 Problems at the start
- Awareness of the information
- Repetitive data collection
- Repetitive data processing
- Lack of consistency
- Time
- Information overload
- Updates
💡 3. Good practices
Units
CAD or BIM: always set the units in the file.
Receiving a file: check the units and fill them in if needed.
Issuing a file: check and fill in the units.
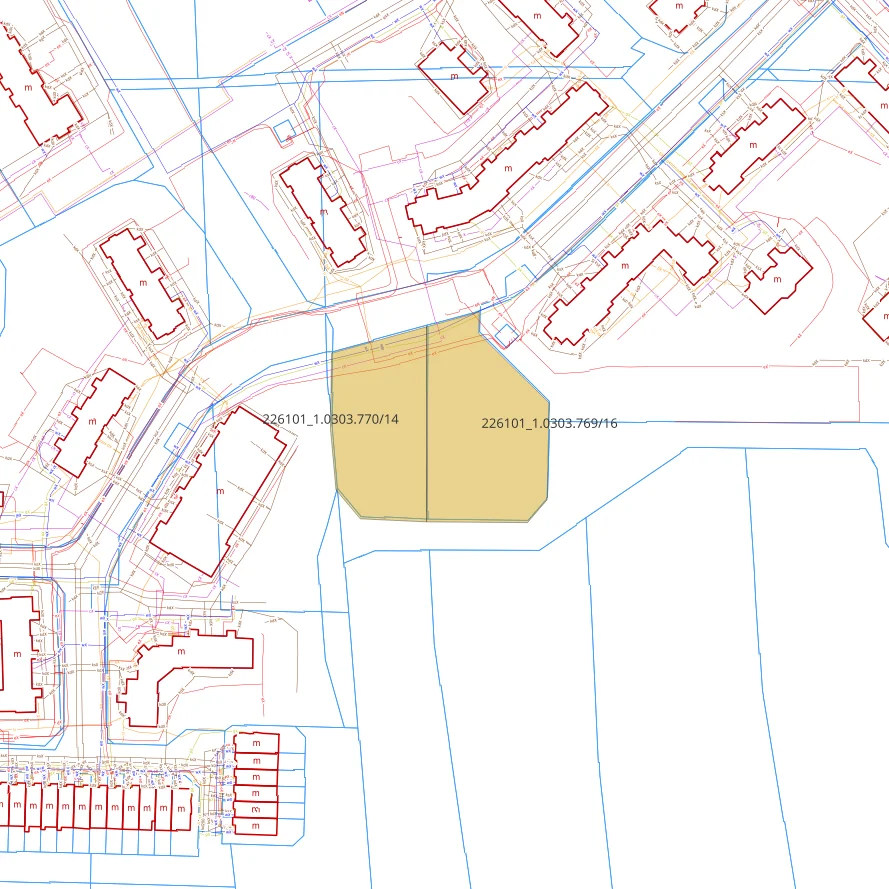
TERYT (Polish land register ID)
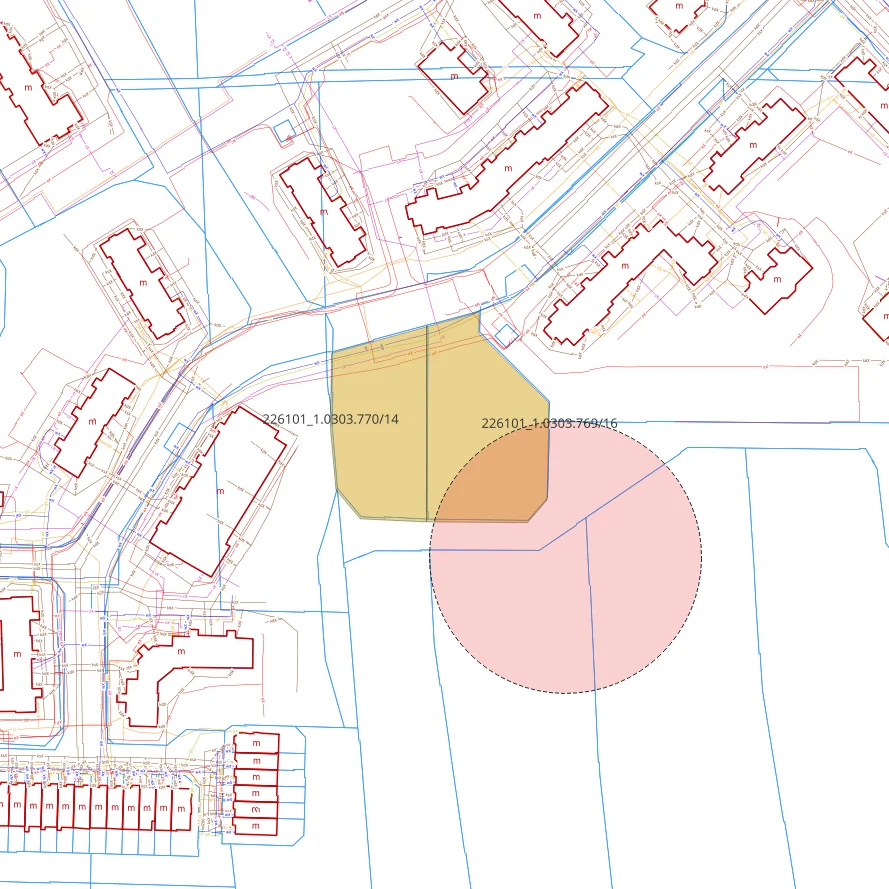
226101_1.0303.769/16
voivodeship · county · municipality _ type . precinct . plot no.
Coordination cube
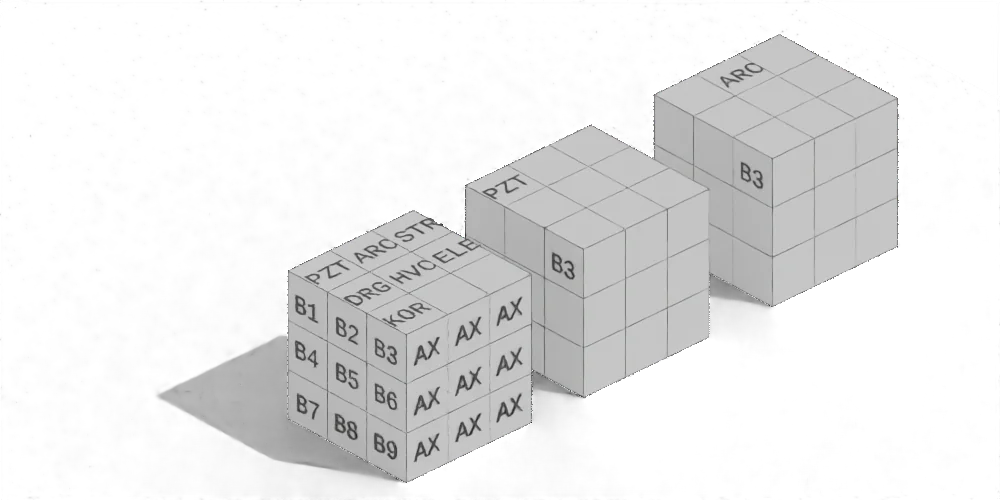
- location – a base point (or even 8)
- scale – differences visible in every direction
- units – 1 m × 1 m × 1 m
- every building in one place (vertical walls)
- every discipline in the building (from the top)
- snapping, aligning, scaling
Optimising the start-up file
- split into smaller parts
- change control
- the minimum of necessary information
- updates
What can I do?
When I can, I reduce the number of families and elements.
When complexity grows, it is better to split it into parts and update simple families quickly.
Simple is better than complex.
Complex is better than complicated.
Zen of Python
Beautiful is better than ugly.
Explicit is better than implicit.
Simple is better than complex.
Complex is better than complicated.
Flat is better than nested.
Sparse is better than dense.
Readability counts.
Special cases aren't special enough to break the rules.
Although practicality beats purity.
Errors should never pass silently.
Unless explicitly silenced.
In the face of ambiguity, refuse the temptation to guess.
There should be one-- and preferably only one --obvious way to do it.
Although that way may not be obvious at first unless you're Dutch.
Now is better than never.
Although never is often better than right now.
If the implementation is hard to explain, it's a bad idea.
If the implementation is easy to explain, it may be a good idea.
Namespaces are one honking great idea – let's do more of those!
Explicit is better than implicit.
Simple is better than complex.
Complex is better than complicated.
Flat is better than nested.
Sparse is better than dense.
Readability counts.
Special cases aren't special enough to break the rules.
Although practicality beats purity.
Errors should never pass silently.
Unless explicitly silenced.
In the face of ambiguity, refuse the temptation to guess.
There should be one-- and preferably only one --obvious way to do it.
Although that way may not be obvious at first unless you're Dutch.
Now is better than never.
Although never is often better than right now.
If the implementation is hard to explain, it's a bad idea.
If the implementation is easy to explain, it may be a good idea.
Namespaces are one honking great idea – let's do more of those!
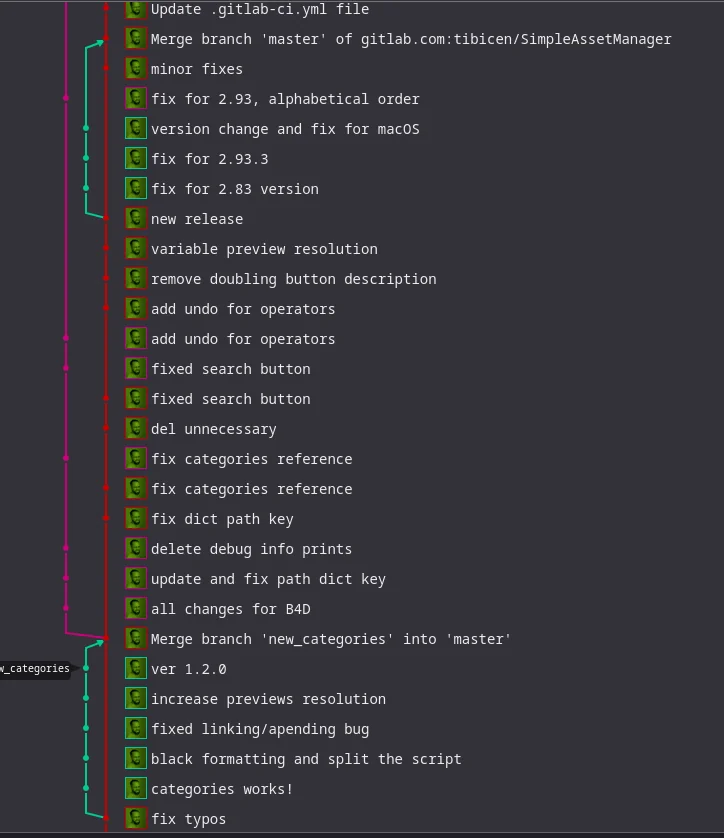
Tracking changes
- git
- tracking users' changes
- IFC
Tracking changes
Tracking changes
IFC vs. plain text
⛏️ 4. Collecting data
The plot
The plot
https://uldk.gugik.gov.pl/?request=GetParcelByXY&xy={x},{y},{epsg}
https://uldk.gugik.gov.pl/?request=GetParcelById&id={teryt}
https://uldk.gugik.gov.pl/?request=GetAggregateArea&id={teryt},{teryt},{teryt}
The plot
def get_plot(project_id, dzialki=None, x=None, y=None, epsg=None, target_epsg=None):
    # https://uldk.gugik.gov.pl/opis.html#
    if epsg and x and y:  # by a point
        req = requests.get(
            f"https://uldk.gugik.gov.pl/?request=GetParcelByXY&xy={x},{y},{epsg}")
    elif isinstance(dzialki, str):  # by a single plot, e.g. '141201_1.0001.1867/2'
        req = requests.get(
            f"https://uldk.gugik.gov.pl/?request=GetParcelById&id={dzialki}")
    elif isinstance(dzialki, list):  # by a list of plots
        req = requests.get(
            f'https://uldk.gugik.gov.pl/?request=GetAggregateArea&id={",".join(dzialki)}')
    else:
        raise ValueError("Invalid input.")

    wkb = req.text.split("\n")[1]
    shape = shapely.from_wkb(wkb)
    if target_epsg:
        epsg = epsg if epsg else 2180
        project = pyproj.Transformer.from_crs(epsg, target_epsg, always_xy=True).transform
        shape = transform(project, shape)
    buffer = shape.buffer(200)
Point cloud
Query: which clouds cover the area
URL = "https://mapy.geoportal.gov.pl/wss/service/PZGIK/DanePomiaroweNMT/WMS/"
x = point.x  # coordinates
y = point.y  # coordinates
url = URL + "SkorowidzeUkladEVRF2007?"
LAYERS = [
    # 'Układ wysokościowy PL-EVRF2007-NH',
    "SkorowidzeLIDAR2023",
    "SkorowidzeLIDAR2022",
    "SkorowidzeLIDAR2021",
    "SkorowidzeLIDAR2020iStarsze",
]
Point cloud
Query: which clouds cover the area
PARAMS = {
    "SERVICE": "WMS",
    "request": "GetFeatureInfo",
    "version": "1.3.0",
    "layers": ",".join(LAYERS),
    "styles": "",
    "crs": f"EPSG:{epsg}",
    "bbox": "%f,%f,%f,%f"
    % (y - distance, x - distance, y + distance, x + distance),
    "width": "101",
    "height": "101",
    "format": "image/png",
    "transparent": "true",
    "query_layers": ",".join(LAYERS),
    "i": "50",
    "j": "50",
    "INFO_FORMAT": "text/html",
}
r = requests.get(url=url, params=PARAMS)
Terrain / toposurface
| x | y | z |
|---|---|---|
| 6214234.55 | 3090904.23 | 110.12 |
| 6325432.32 | 3090904.23 | 110.12 |
| 6325432.32 | 3090904.23 | 110.12 |
| 6325432.32 | 3090904.23 | 110.12 |
3D buildings
url = "http://mapy.geoportal.gov.pl/wss/service/PZGIK/PRG/WFS/AdministrativeBoundaries?language=pol&"
distance = 50
PARAMS = {
    "SERVICE": "WFS",
    "request": "GetFeature",
    "version": "2.0.0",
    "typenames": "ms:A02_Granice_powiatow",
    "crs": f"EPSG:{epsg}",
    "bbox": "{:f},{:f},{:f},{:f}".format(y - distance, x - distance, y + distance, x + distance),
    "FORMAT": "application/gml+xml",
    "WIDTH": 101,
    "HEIGHT": 101,
    "i": 50,
    "j": 50,
}
r = requests.get(url=url, params=PARAMS)
3D buildings
url = f"https://opendata.geoportal.gov.pl/InneDane/Budynki3D/LOD1/2022/{id_powiatu[:2]}/{id_powiatu}.zip"
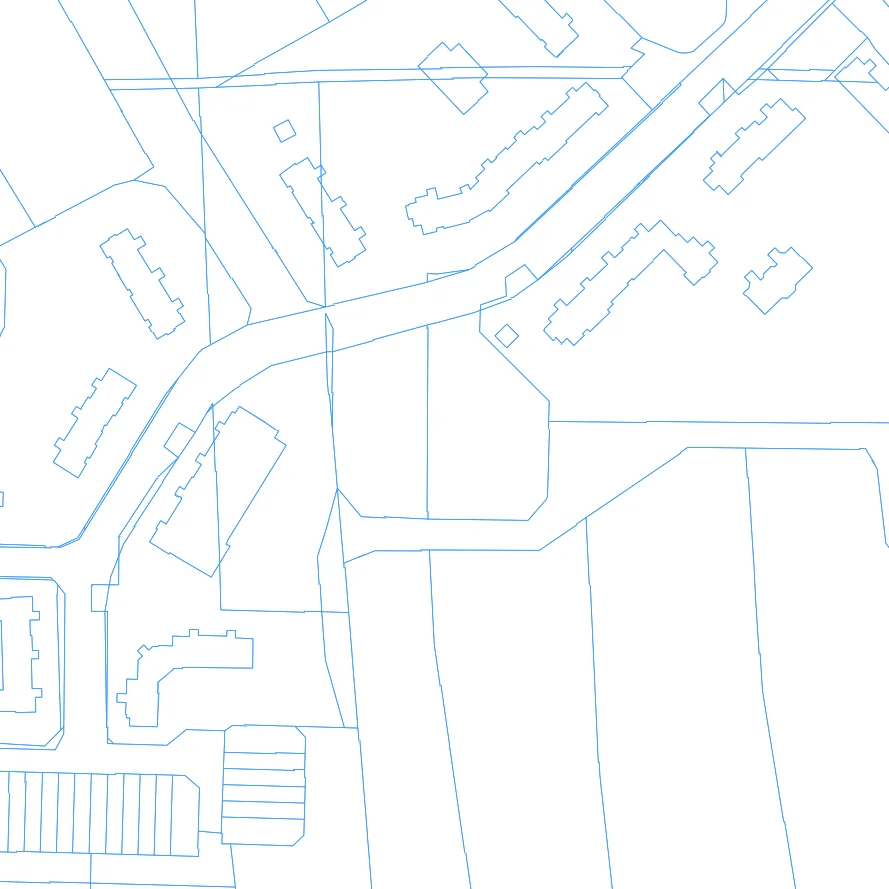
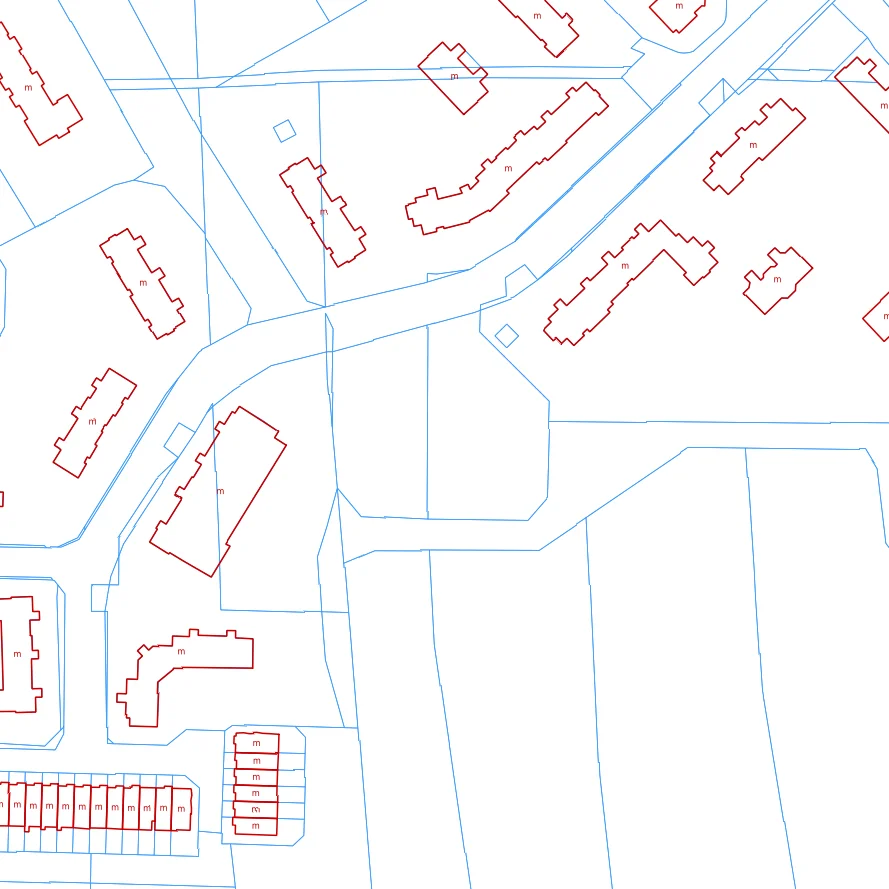
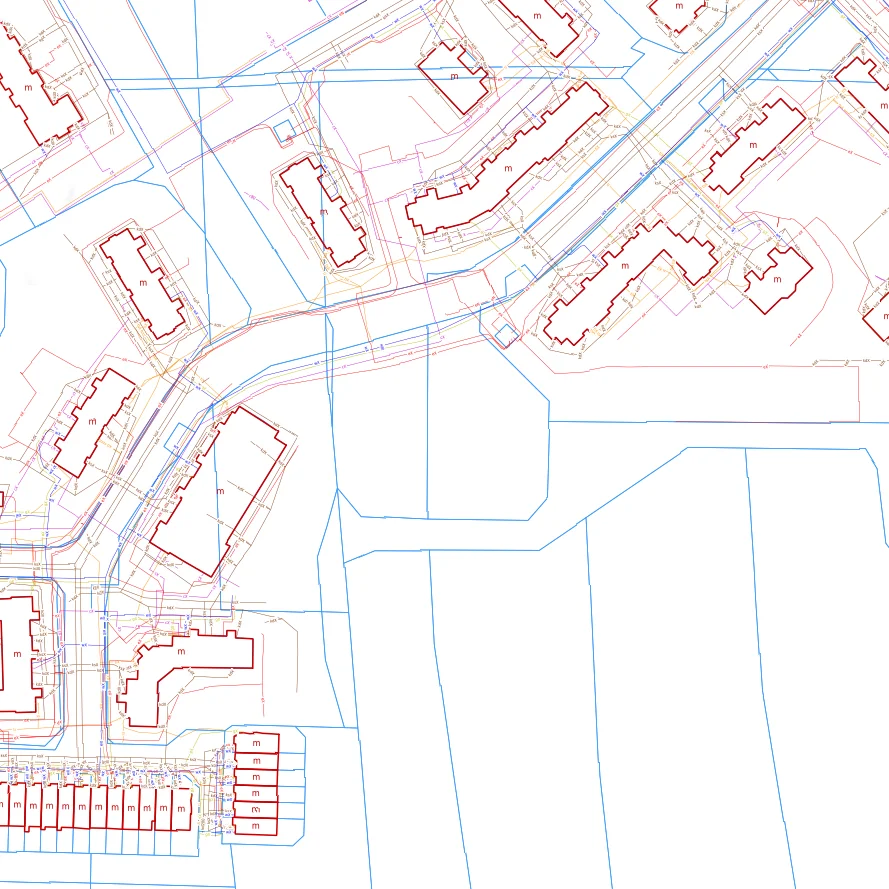
WMS / WFS
- Orthophoto map
- Utility networks
- Local zoning plans – vector / image
- Roads – vector
- BDOT topographic database – vector
WMS / WFS
Counties and the geoportal
WMS / WFS
WMS / WFS
WMS / WFS
🧹 5. Managing data
shapely
shape = get_plot(project_id, dzialki=dzialki)
buffer = shape.buffer(200)
center = shape.centroid
shapely
shapely
shapely
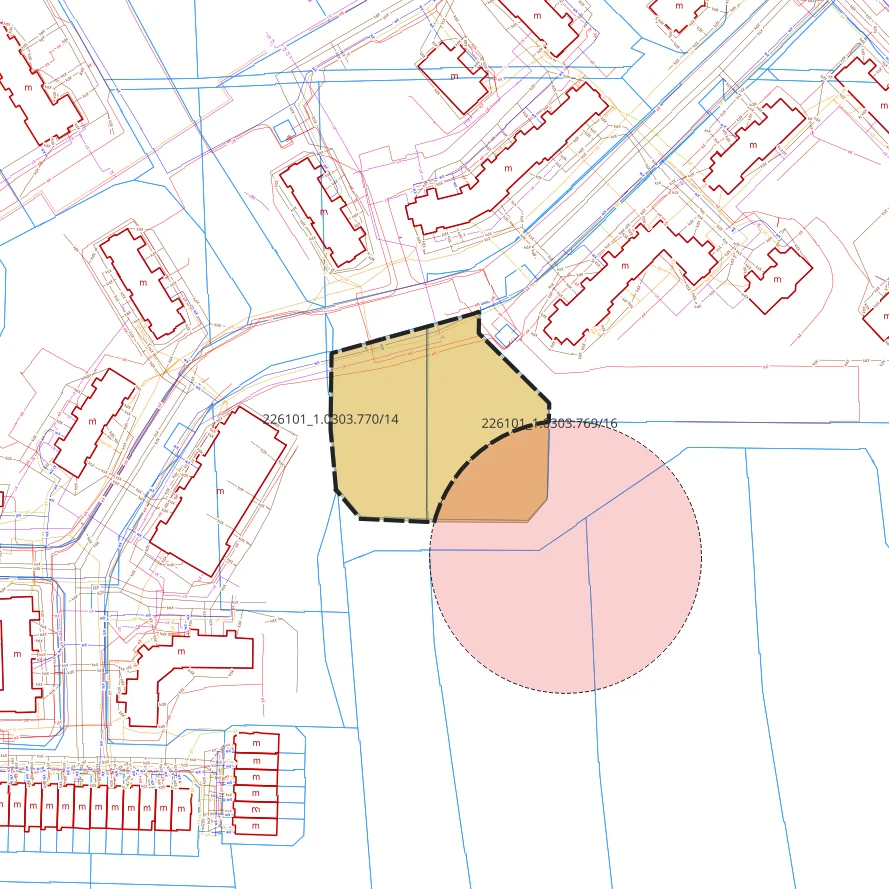
- polygon.intersection(other_polygon)
- polygon.difference(other_polygon)
- polygon.union(other_polygon)
- polygon.buffer(distance)
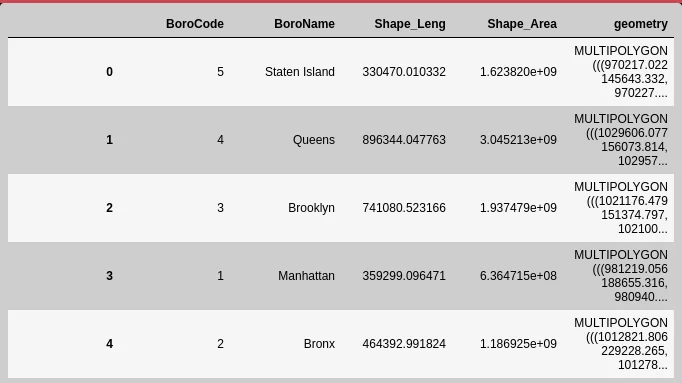
geopandas
managing data
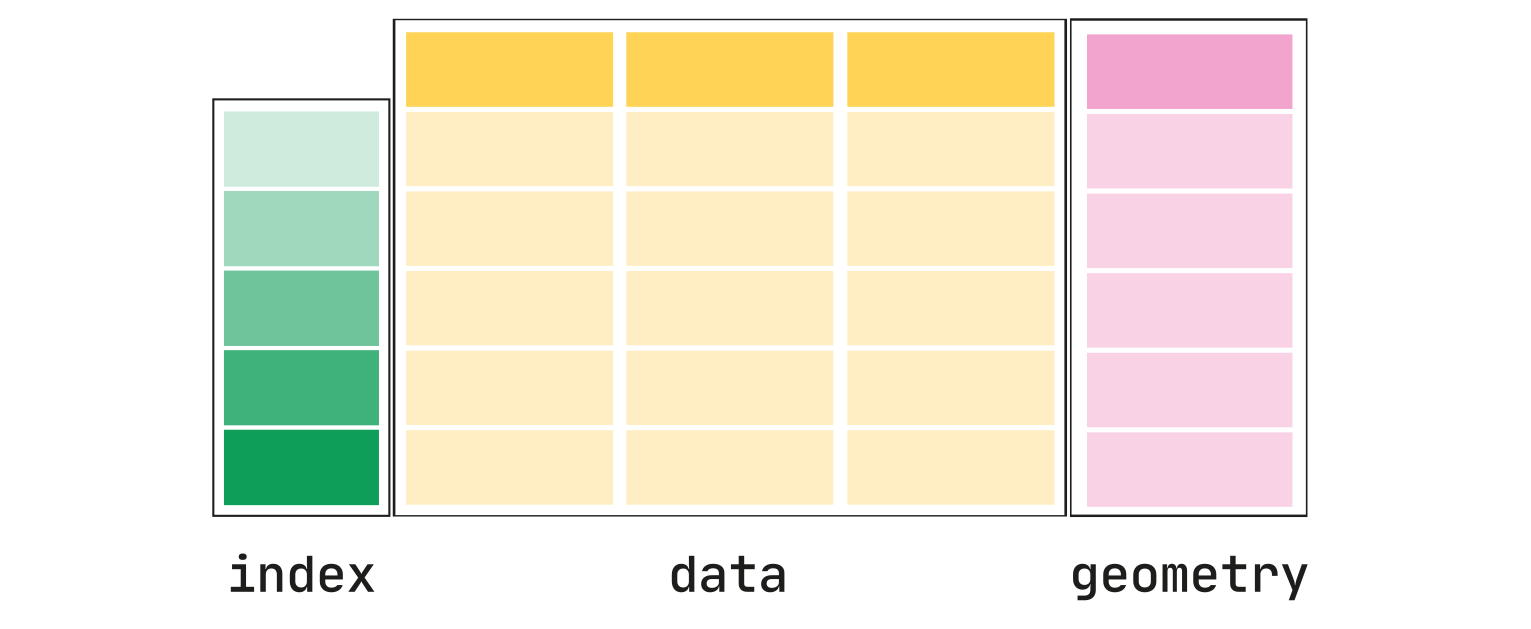
geopandas
laspy / PDAL
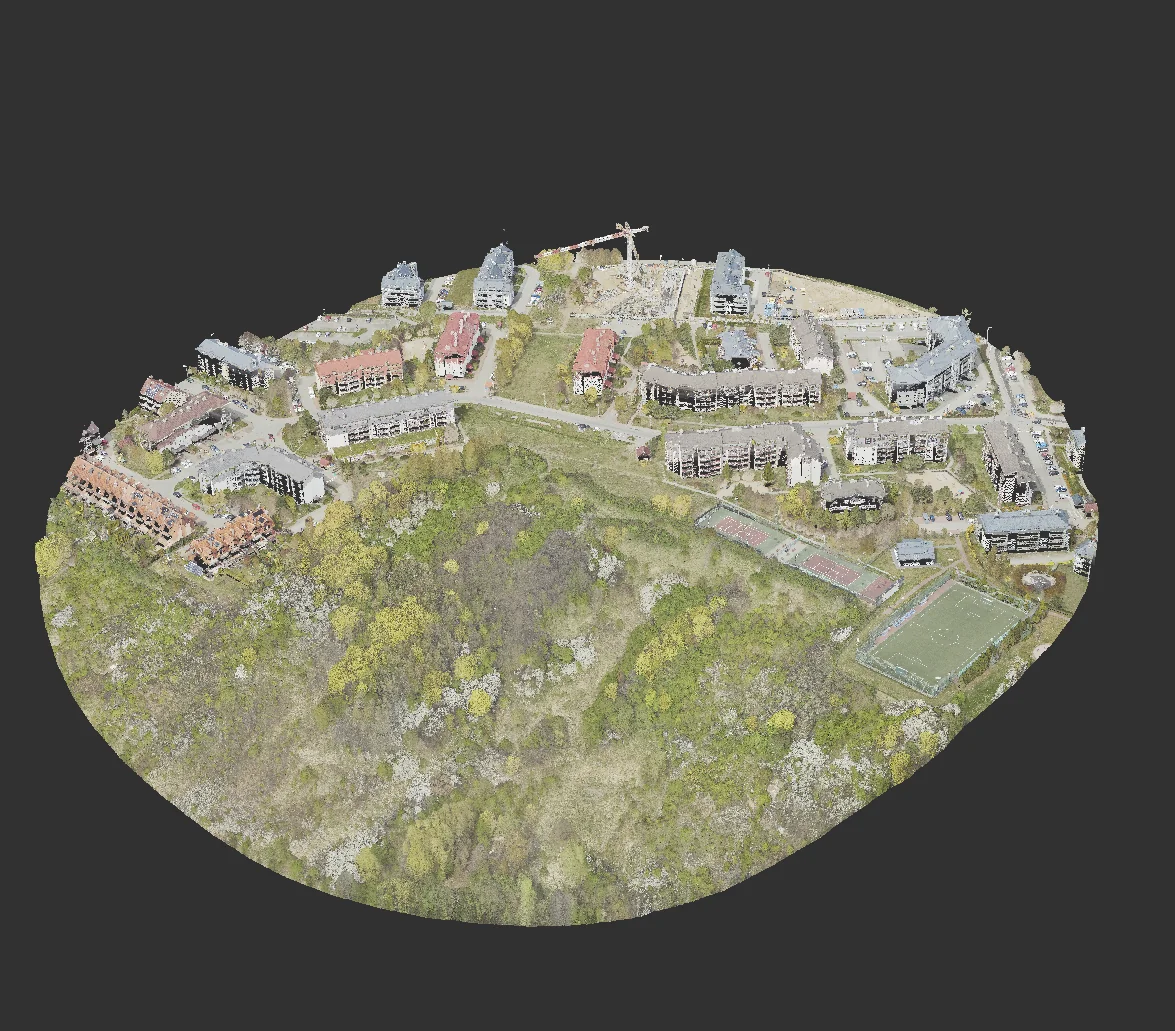
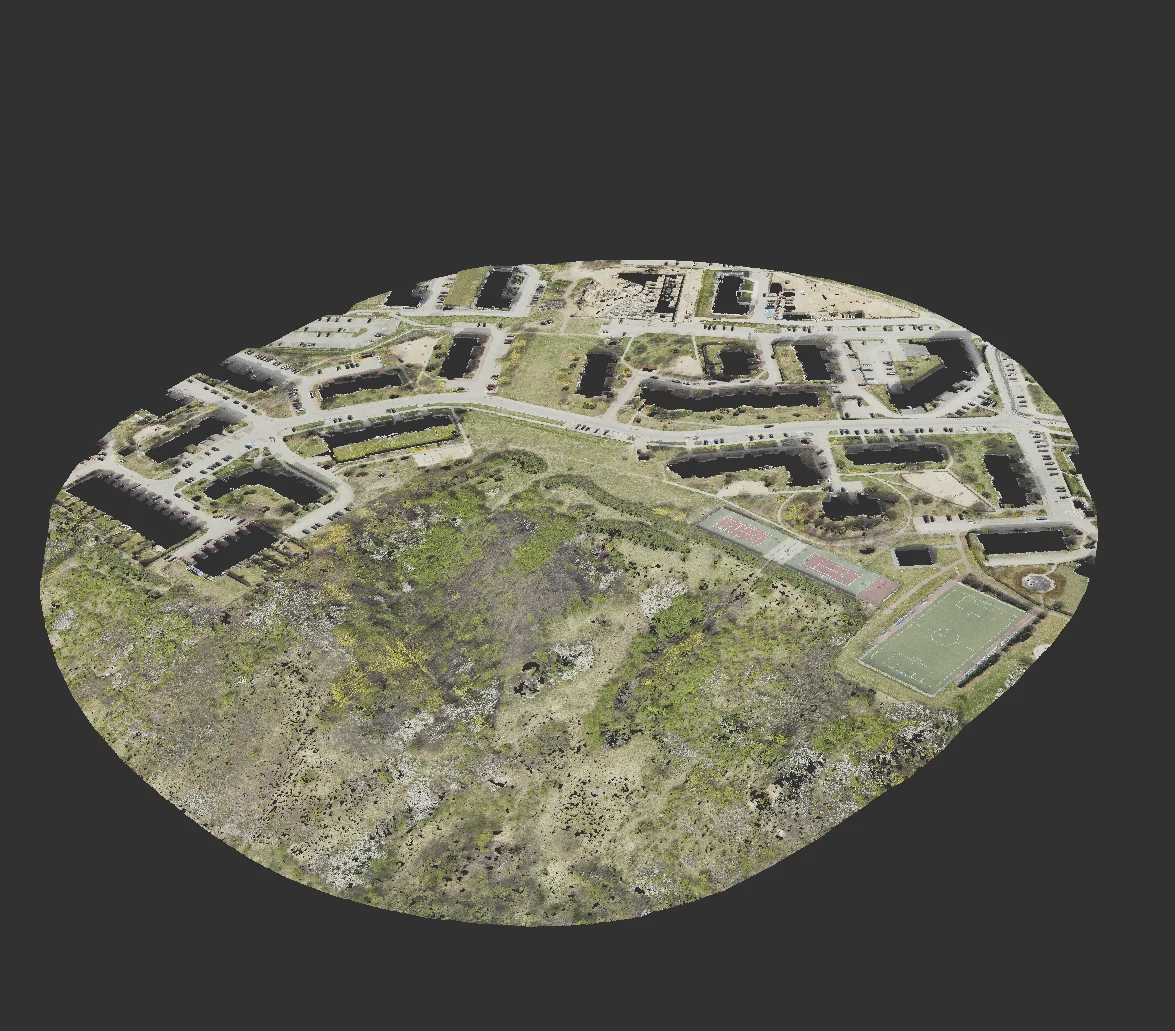
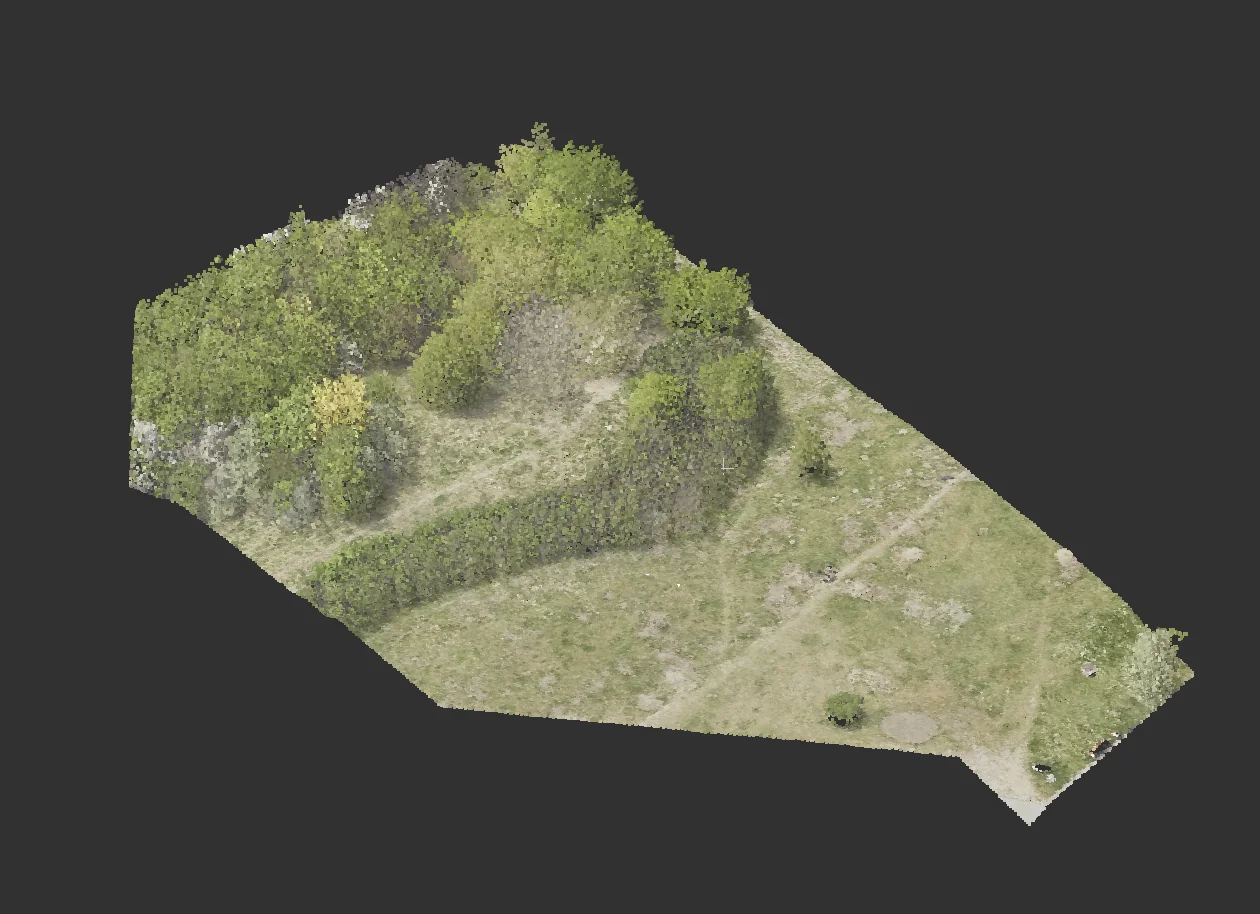
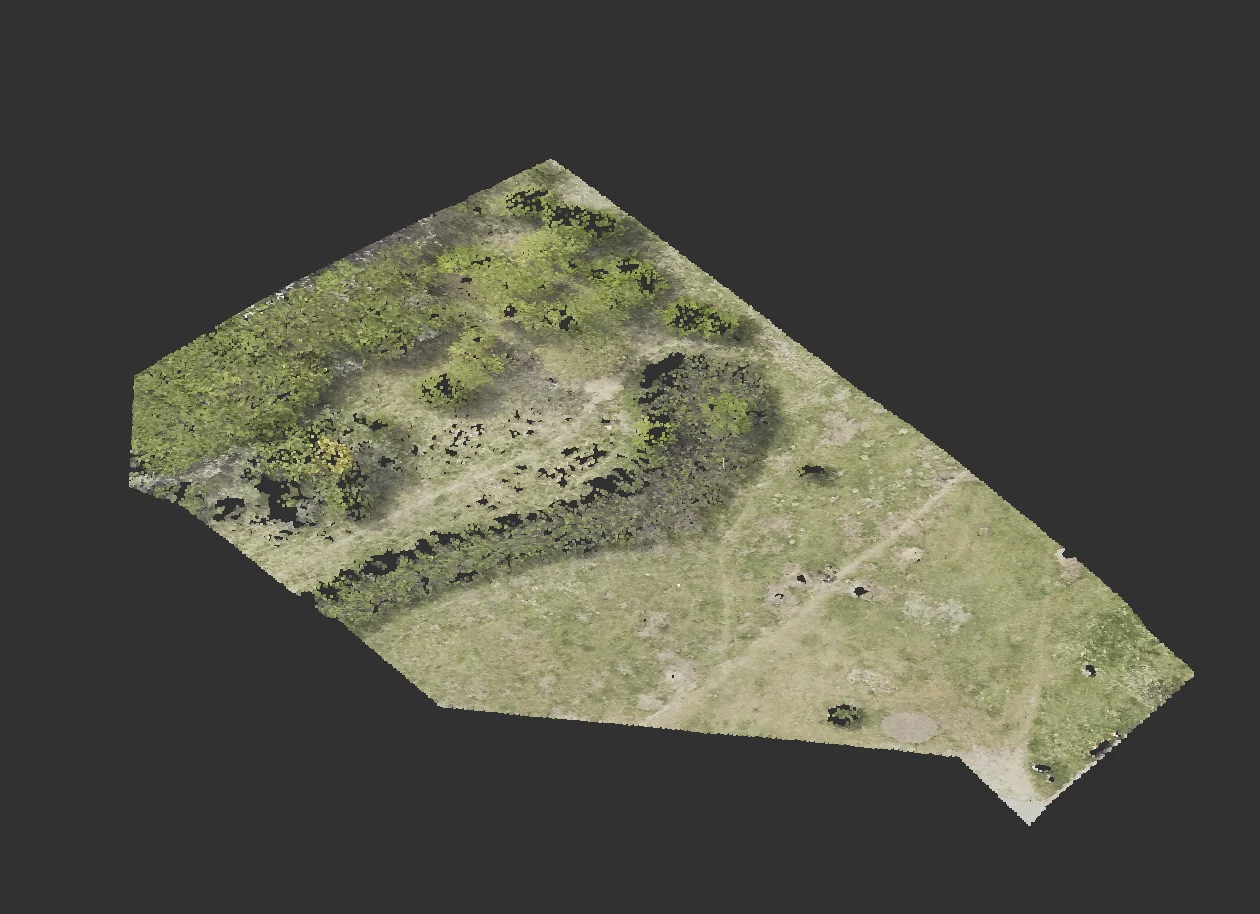
- processing point clouds and las/laz files
- filtering
- geolocation
- transposition
- reprojection
- classification
laspy / PDAL
def join_and_split_point_clouds(las_fp, shape, buffer, proj_id):
    points, header = merge_clouds(las_fp)
    las = laspy.LasData(header)
    las.points = points
    clouds = {}
    buffer_mask = get_site_mask(points, buffer)
    buffer_points = las.points[buffer_mask]
    clouds["buffer-teren"] = buffer_points[buffer_points.classification == 2]
    print("Filtered buffer-teren")
    site_mask = get_site_mask(points, shape)
    dzialka_points = las.points[site_mask]
    buffer_without_site_mask = np.array([buffer_mask, ~site_mask]).min(axis=0)
    clouds["buffer"] = las.points[buffer_without_site_mask]
    print("Filtered buffer")
    cl = dzialka_points.classification
    clouds["dzialka-teren"] = dzialka_points[cl == 2]
    print("Filtered dzialka teren")
    zielen_mask = np.array([cl == 3, cl == 4, cl == 5]).max(axis=0)
    clouds["dzialka-zielen"] = dzialka_points[zielen_mask]
    clouds["dzialka-budynki"] = dzialka_points[cl == 6]
    print("Filtered dzialka budynki dzialka zielen")
    fpaths = []
    for x in clouds:
        las.points = clouds[x]
        fp = os.path.join("output", f"{proj_id}-{x}.laz")
        las.write(fp)
        fpaths.append(fp)
    return fpaths, clouds, las
laspy / PDAL
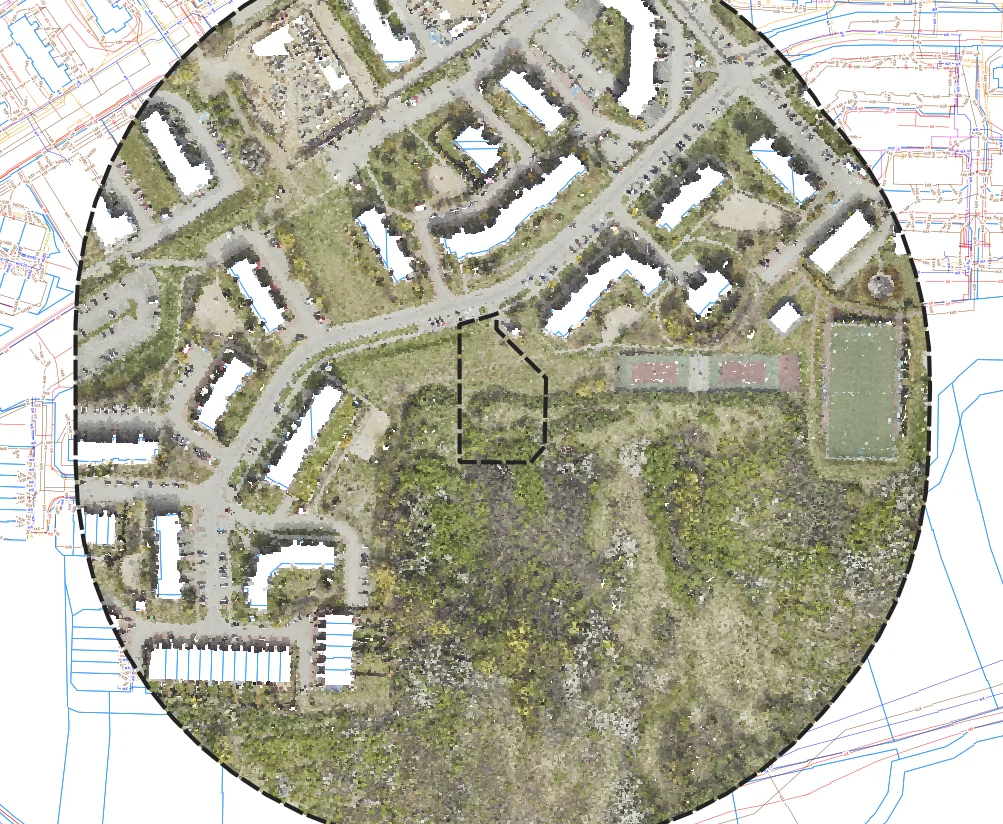
laspy / PDAL
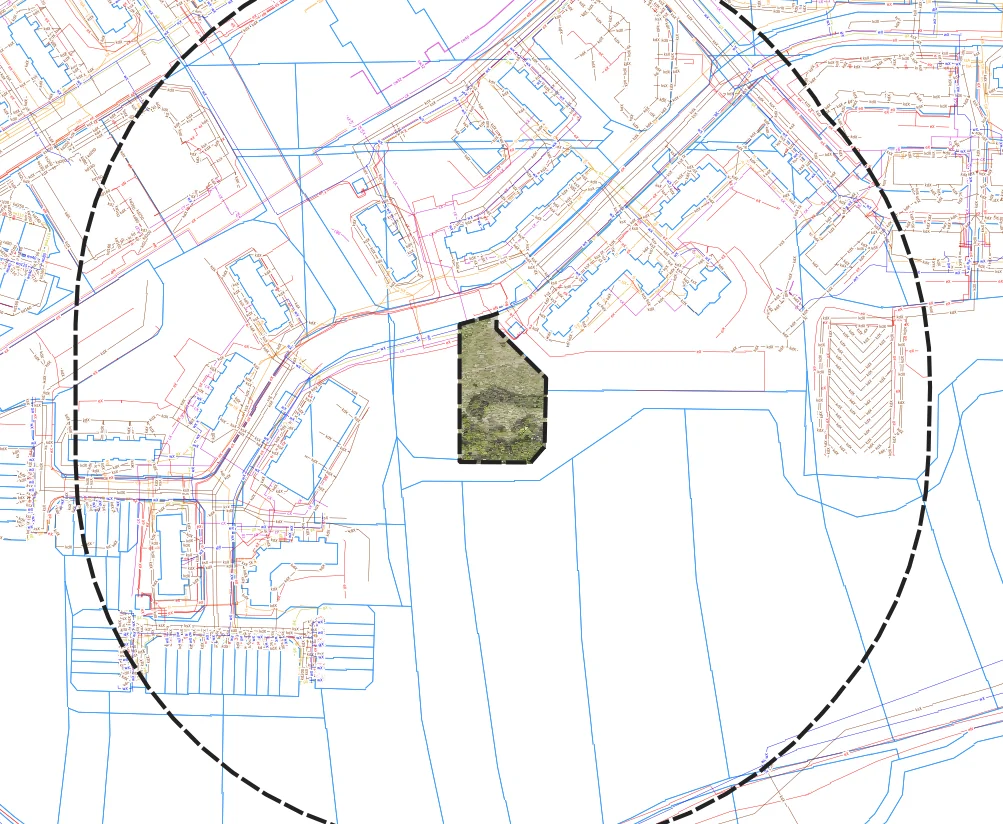
laspy / PDAL
laspy / PDAL
laspy / PDAL
laspy / PDAL
📚 6. Helpful libraries
- shapely
- pandas
- geopandas
- pyproj
- laspy
shapely
- 2D
- buffer / offset
- cutting / intersecting
- polygon operations
- import / export of various 2D formats
pandas
- Excel on steroids
- DataFrame
- any data
- advanced and automatic filtering
- import / export to Excel, CSV etc.